The Social Security Administration’s (SSA) disability determination process has five phases: initial application, reconsideration, ALJ hearing, appeals council review, and a federal court decision. While benefits could be awarded immediately to a select few qualifying applicants, the process for most claimants is far from linear, with over half of initial applications denied.
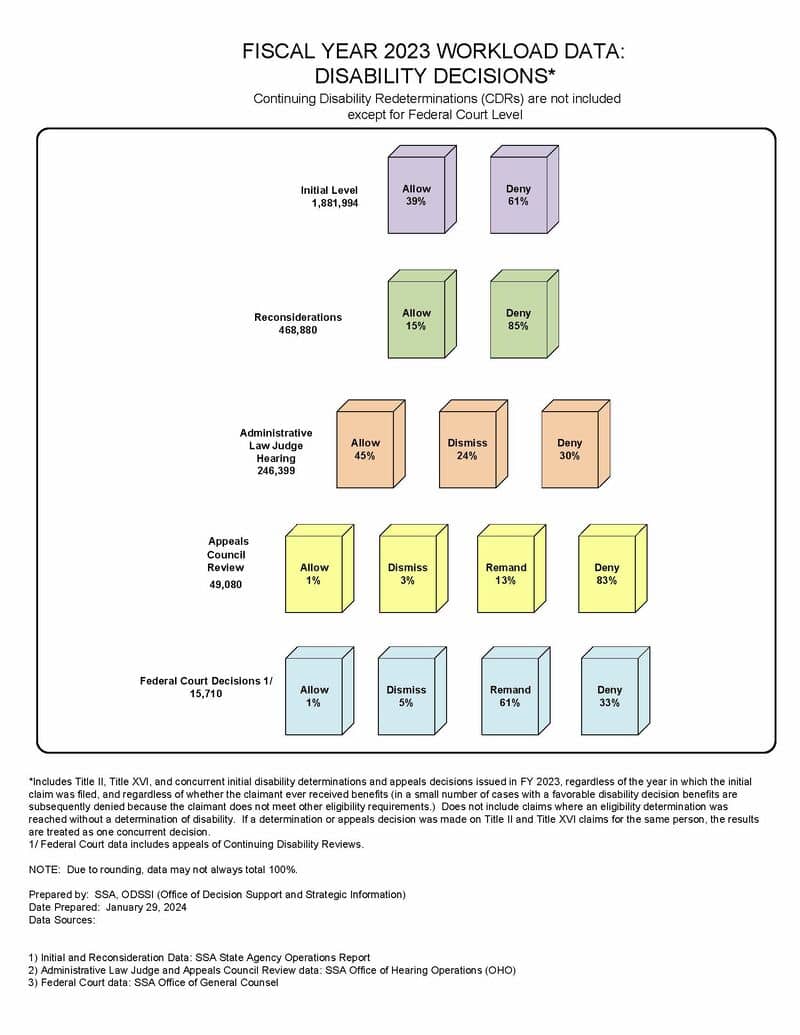
The SSA releases its annual waterfall chart to help depict this process. A waterfall chart visually represents the various stages and outcomes within the disability determination process, typically employed by government agencies such as the Social Security Administration (SSA) or disability advocacy organizations. This chart provides a comprehensive overview of how disability claims progress through different levels of review, illustrating the flow of cases and the distribution of outcomes at each stage.
Here’s what you should know about the SSA waterfall chart for the 2023 fiscal year:
Initial Applications
At the initial level, 1,881,994 individuals submitted their disability claims for consideration. 39% of claims were approved, while 61% were unfortunately denied. This statistic underscores the challenge applicants immediately face in meeting the SSA’s eligibility criteria.
Reconsiderations
Following an initial denial, 468,880 claimants began the appeals process and pursued reconsideration, aiming to strengthen their cases with additional evidence or clarifications. Unfortunately, 85% of reconsideration requests were denied.
Administrative Law Judge Hearings
After a second denial, 246,399 claimants moved forward to Administrative Law Judge (ALJ) hearings. Regrettably, 30% of cases were denied at this stage, and 24% were dismissed.
Appeals Council Reviews
In the penultimate stage of disability with 49,080 claimants, only 1% of cases were approved at this stage, 60% were remanded, and 30% were denied after an Appeals Council Review.
Federal Court Decisions
Finally, 15,710 claimants had one last opportunity to make their case to the SSA, with 1% approved, 5% dismissed, 61% remanded, and 33% denied.
Overall, a disability waterfall chart serves as a valuable tool for individuals applying for disability benefits with their attorneys, providing insights into the disability determination process and approval rates at each level.
Disability Attorneys and Advocates in North Carolina
At Henson Fuerst, our Social Security disability lawyers understand claimants’ challenges when navigating the complex disability claims process. With our wealth of experience and dedicated team of legal professionals, we are committed to providing unwavering support and guidance to disability applicants every step of the way. From initial consultation to final resolution, our attorneys work tirelessly to advocate for our clients’ rights and ensure they receive the benefits they deserve.
Contact us by submitting a form online or calling our office at 919-781-1107 for a free case evaluation.

